Sharp Charts
SharpCharts is the name of our award-winning bar/candlestick charting program. Most people who visit StockCharts.com, come to use SharpCharts.
Technically, the term “SharpCharts” refers to the charts themselves. The page that you use to create/modify a SharpChart is called the “SharpCharts Workbench” however the workbench is often also referred to as just “SharpCharts.”
Overview
A SharpChart is a technical chart that plots price values over time. SharpCharts have a large number of chart settings that can be used to customize things as well as huge collection of technical indicators and overlays that can be added. A complete description of all of the chart types and technical indicators supported by SharpCharts can be found in the ChartSchool area of our website.
SharpCharts are sent to your web browser as a regular Internet image file (in “png” format). That means that you can treat a SharpChart exactly the same as how you treat any other Internet-based image. You can copy and paste it into other documents. You can save it to your hard disk or into a photo organizing program. You can email it to friends, draw on it with a drawing program, etc.
It also means that you do not have to install any additional browser plug-ins or other software in order to view our charts. They can be viewed on any Internet connected device that has a web browser.
SharpCharts Format
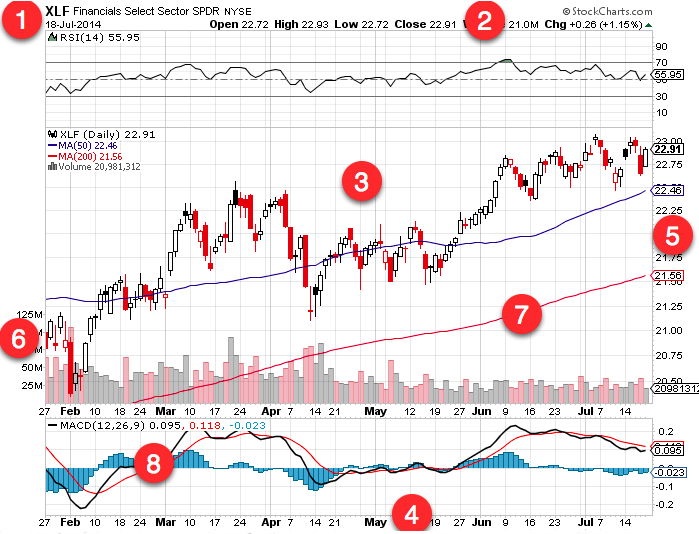
All SharpCharts have several common visual elements regardless of their settings. These common elements include:
- The The Main Ticker symbol
- The Chart Header area
- The Price Plot area
- The Horizontal Time axis
- The Primary Vertical axis
- (Optional) A Secondary Vertical axis
- (Optional) One or more Technical Overlays
- (Optional) One or more Technical Indicator panels
The SharpCharts Workbench
Again, the SharpCharts Workbench is the name of the web page with all the settings that you use to create and modify a SharpChart. There are many ways to pull up the SharpCharts Workbench including:
- Clicking on a ticker symbol anywhere on our website
- Typing a ticker symbol into the “Create a Chart” box and press “Go”
- Using the “Start to Chart” boxes on the home page.
- Clicking on many of the charts in our Blogs and ChartSchool areas.
- Clicking on the SharpCharts icons on our various reports and scan results pages.
In general, you use the workbench by changing one or more of the settings boxes on the page and then clicking one of the “Update” buttons on the page to apply the new settings to your chart. All of the “Update” buttons do the same thing - just click on the one that is more convenient
In the upper left corner of the workbench page is the main ticker symbol box. The symbol in that box is always plotted in the main price plot area of the chart. The quote at the top of the chart always corresponds to that main ticker symbol.
Tip: If you haven't clicked anywhere else on the page, simply typing in a new ticker symbol and pressing Enter will show you a chart of the symbol you typed.
Next to the main symbol box is the Period dropdown. It lets you select the time duration (i.e., the period) for each bar/candlestick on the chart. Free users can choose between “Daily” and “Weekly” bars. Members have access to many more choices including 1-,2-,5-,10-,30-,60- and 120-minute bars as well as monthly and even yearly bars. For more specifics, please see the Data Bar Periods documentation
Chart Attributes
Chart Attributes are settings that affect the chart as a whole. These particular settings are contained in the “Chart Attributes” area located below the chart itself. Here's what that area looks like:
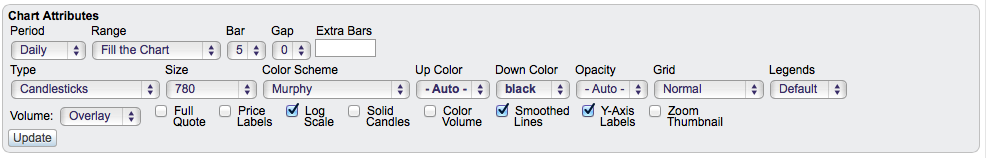
The Period dropdown is the same as the Period dropdown above the chart.
The Range dropdown lets you specify the starting and ending dates for your chart (i.e., the horizontal axis). There are three different modes for setting a chart's range:
- Fill the Chart mode - for when you want to see the latest data clearly. You specify the bar width and bar gap (in pixels) and we draw as many bars on the chart as space allows. You can also optionally specify the amount of blank space you'd like up to leave on the right side of the chart (i.e. Extra Bars).
- Years/Months/Days mode - for when you want to see a specific amount of recent data. You specify how much time you'd like to be displayed on the chart and we will display that amount of data - scrunching/eliminating bars if there is not enough room.
- Select Start/End mode - for when you want to see a time period in the past. You specify the start and end dates as calendar dates and we will display all the data bars between those two dates - scrunching/eliminating bars if there is not enough room. You can also use the “Ranger” slider control that appears to interactively change the start and end date.
The Type dropdown lets you choose the overall type of chart that you want to see. Examples include OHLC Bar charts, Candlestick charts, Line charts, etc. For a complete list of the chart types available and how they can be used, please see our ChartSchool articles on Chart Types.
The Size dropdown lets you choose the overall width of your chart (in pixels). StockCharts members have different width choices depending on their service level.
The Color Scheme dropdown lets you change the colors that we use to create the chart. Certain color schemes also allow you to change the colors for the entire workbench (i.e., the workbench's “skin”). If one of those schemes is selected, a “Skin” checkbox will appear above the chart which allows you to turn on that feature.
Up Color/Down Color dropdowns let you change the color of the price bars in the main price plot panel.
The Opacity dropdown lets you change how transparent the main price plot is in the main price plot panel.
The Grid dropdown lets you change how many grid lines appear in the background of your chart.
The Legends dropdown lets you change how much information is displayed in the upper left corner of each panel in your chart.
The Volume dropdown lets you easily specify how you want the volume histogram to appear on your chart.
The Full Quote checkbox adds an information box to the top of your chart that includes additional data about the main ticker symbol including Bid/Ask data, P/E and EPS ratios, VWAP, SCTR, and the sector/industry that the stock belongs to (if available).
The Price Labels checkbox adds data labels at significant peaks and troughs on the chart that tell you the high and low price data for each of those points.
The Log Scale checkbox changes the vertical scale for the Price Plot panel from arithmetic scaling (unchecked) to Logarithmic scaling (checked). Percent changes in price are constant on a log scale chart.
The Solid Candles checkbox fills in all candlesticks with solid colors instead of having the more traditional hollow candlesticks when prices increase.
The Color Volume checkbox causes the bars of the volume histogram to be colored so that they match the chart's price bars.
The Smoothed Lines checkbox causes us to use anti-aliasing techniques to make curved lines appear smoother.
The Y-Axis Labels checkbox adds labels to the primary vertical axis showing the final value for each indicator line on the chart.
The Zoom Thumbnail checkbox adds a narrow vertical column to the right side of the chart that shows the final 20 time periods for the chart - usually in more details than on the regular chart.
Adding Overlays
Technical Overlays are lines that are calculated from price and volume data. They are displayed on top of the main symbol's price bars. They are calculated using the same vertical scale as the price bars. Examples include moving average lines, Bollinger Bands and Pivot Point lines. Here is an example of a chart that includes several overlays:
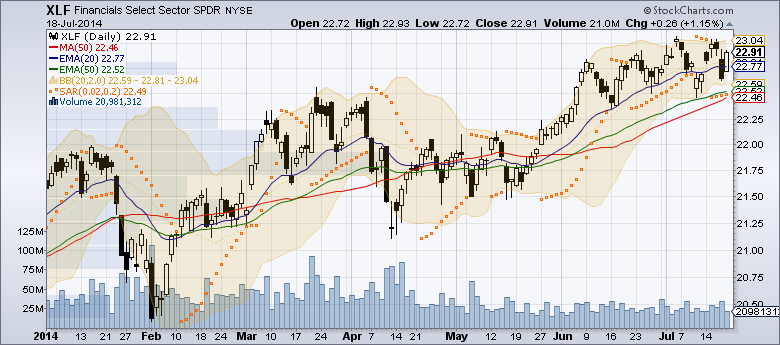
For detailed information on all of the different technical overlays we offer, please see our ChartSchool area on overlays.
To add an overlay to a SharpChart, use the next available line in the Overlays section of the workbench (located just below the Chart Attributes section).
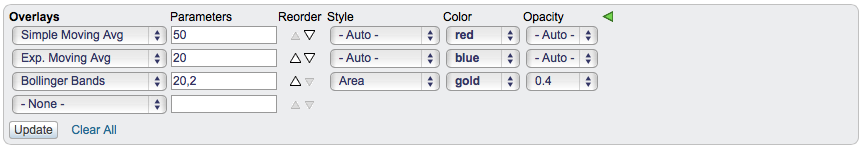
Each line in the Overlays section has a main dropdown, a Parameters box and (optionally) the advanced settings boxes. Free users only have access to 3 overlays per chart and cannot use the advanced settings. Member can add up to 25 different overlays to their charts. As soon as the last available overlay line is used, a new line will appear beneath it allowing you to add more.
The Parameters box allows you to enter whatever parameters the technical indicator needs. Some indicators do not need any parameters - others support 5 or more different settings via the Parameters box. Individual settings within the box are separated from one another using commas. Many parameters are optional - if you do not specify a particular parameter, a commonly used default setting will be used instead.
The Reorder Arrows allow you to change the order of the overlay lines on the workbench. Just click on an up or down arrow to move the entire overlay line up or down on the list.
The Style dropdown allows members to change the style of the overlay's line.
The Color dropdown allows members to change the color of the overlay's line.
The Opacity dropdown allows members to change the transparency of the overlay's line.
Finally, there is a “Clear All” link at the bottom of the Overlays section. Clicking that link (and then confirming your intentions in a message box that appears) will cause all of the Overlay settings for your current chart to be erased.
Adding Indicators
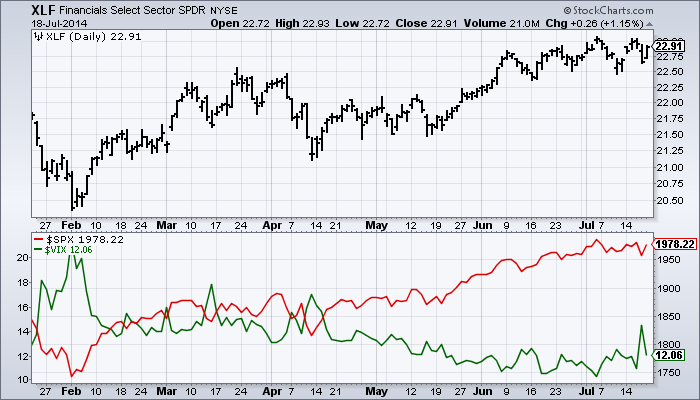
Technical Indicators are lines that are calculated from price and volume data. Indicators differ from overlays in that usually they do not contain price values and thus they are plotted on different vertical scales from the price bars. For that reason, they typically appear in separate panels above/below the main price plot area. Some examples of commonly used technical indicators include MACD, RSI and Stochastics. Here is a chart that contains several technical indicators:
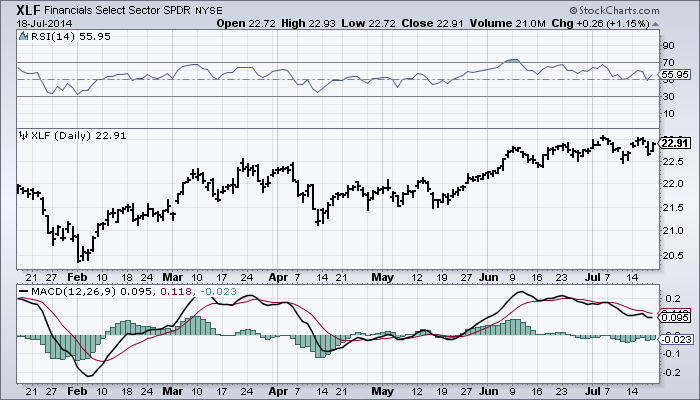
For detailed information on all of the different technical indicators we offer, please see our ChartSchool area on indicators.
To add an indicator to a SharpChart, use the next available line in the Indicators section of the workbench (located just below the Overlays section).
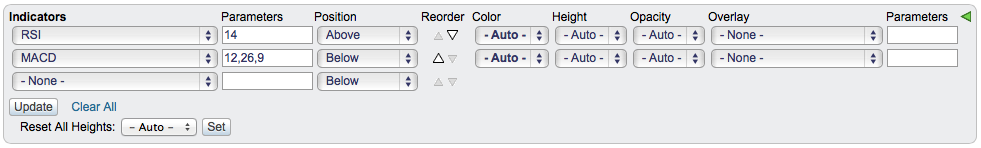
Each line in the Indicators section has a main dropdown, a Parameters box and (optionally) the advanced settings boxes. Free users only have access to 3 indicators per chart and cannot use the advanced settings. Members can add up to 25 different indicators to their charts. As soon as the last available indicator line is used, a new line will appear beneath it allowing you to add more.
The Parameters box allows you to enter whatever parameters the technical indicator needs. Some indicators do not need any parameters - others support 5 or more different settings via the Parameters box. Individual settings within the box are separated from one another using commas. Many parameters are optional - if you do not specify a particular parameter, a commonly used default setting will be used instead.
The Position dropdown allows you to specify whether the indicator appears in a panel above the price plot area, below the price plot area, behind price (i.e., overlaying the price bars inside the price plot area) or behind indicator (i.e., overlaying the indicator immediately above it on the indicator list). The Reorder Arrows allow you to change the order of the indicator lines on the workbench. Just click on an up or down arrow to move the entire overlay line up or down on the list.
The Style dropdown allows members to change the style of the indicator's line.
The Color dropdown allows members to change the color of the indicator's line.
The Opacity dropdown allows members to change the transparency of the indicator's line.
Finally, there is a “Clear All” link at the bottom of the Indicators section. Clicking that link (and then confirming your intentions in a message box that appears) will cause all of the Indicator settings for your current chart to be erased.
The Price Indicator
There is one special indicator in the Indicator dropdown that we wanted to single out because it is used in many of our charts - the “Price” Indicator. The Price indicator takes a single parameter - a ticker symbol. The Price indicator does not really do any calculations per se, instead it simply takes that data for the given ticker symbol and adds it to the chart.
The Price indicator allows you to compare several different ticker symbols - typically market indicators, indexes or closely related stocks. Here is an example of a chart that uses a price indicator:
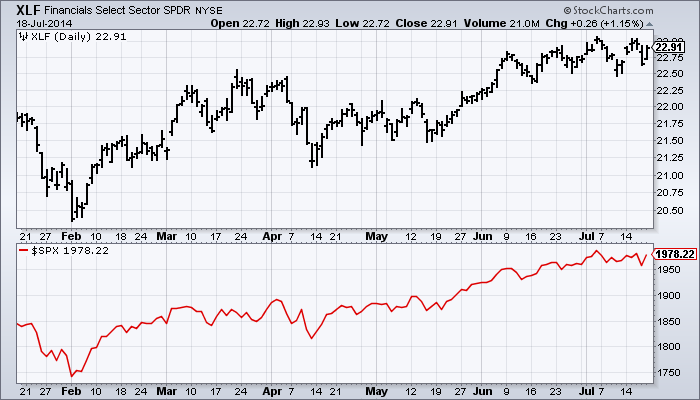
Note: Because they can have a heavy impact on the performance of our servers, there is a limit on the number of ticker symbols (a.k.a. “datasets”) that each chart can have. For free users, that limit is 3. For Basic and Extra members, the limit is 6. For PRO members, the limit is 10.
Creating Overlaid Charts
The Price Indicator can be used in conjunction with the “Behind Price” Position setting to create overlaid charts. Here is an example
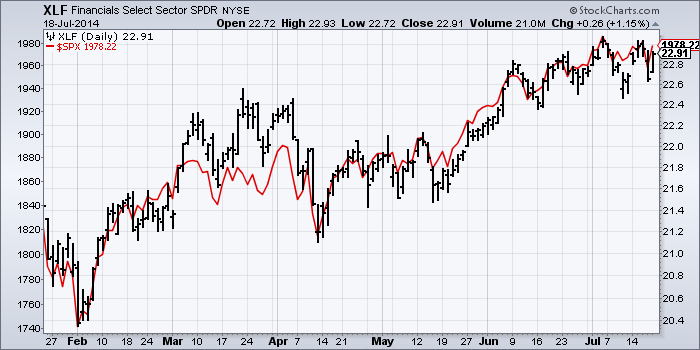
In addition, two or more Price indicators can be overlaid on top of themselves by using the “Behind Indicator” Position setting. Here is an example:
Performance Comparison SharpCharts
The “Price Performance” indicator is similar to the “Price” indicator with one key difference - it plots the cumulative percent change in the given ticker symbol starting at the left edge of the chart. It allows you to compare the performance of several different ticker symbols by plotting their Price Performance in an overlaid manner (i.e., using the “Behind Price” Position setting). This is identical to what our Interactive PerfChart tool does. Here is an example:
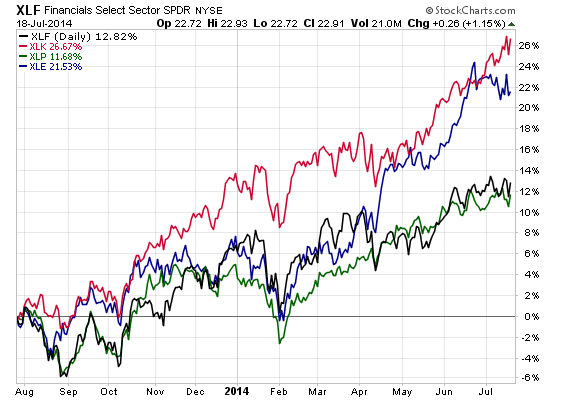
The advantage of creating Performance Charts in SharpCharts is that you can then annotate them and/or store them in your account for later review.
Tip: You can also create SharpChart-based Performance Charts quickly by entering several ticker symbols separated by commas into the “Create a Chart” box at the top of any of our pages and then pressing “Go”. In addition to being quicker, this approach has the ability to use one of the ticker symbols as the “baseline” of your performance comparison but checking a checkbox. Click here to see an example.
The Inspector
If you want to examine the data that makes up the bars on a SharpChart, you can check the Inspect checkbox located above the chart and then move your mouse over the chart. An interactive cursor will appear that allows you to see the data values for each bar as you move over it. You can also click and drag your mouse either horizontally or vertically to measure time/price distances between two points.
Note: When the Inspector loads, it re-requests your chart with lots of additional data. That additional data can slow down the chart's loading time significantly. For that reason, only enable the Inspector checkbox when you really need it.
Auto-Refresh
You can always update a SharpChart with the latest data by manually clicking the “Update” button on the SharpCharts workbench.
In addition, when the markets are open, the Refresh dropdown allows members to automatically update the data for the SharpChart that is currently on the workbench. The dropdown can be used to specify how frequently the chart updates. Basic and Extra members can have charts update as frequently as once every 15 seconds. PRO members can have charts update as frequently as once every 5 seconds.
By combining our auto-refresh feature with your browser's ability to open multiple tabs/windows, it is possible to create large collections of auto-updating charts. However before doing that, you need to understand our “chart requests per second” limitation. Essentially, Basic and Extra members cannot automatically request more than 1 chart per second from our servers (on average over an extended period of time). Similarly, PRO members cannot request more than 2 charts per second.
For example, if a Basic member opens 15 different browser tabs and has a SharpChart auto-refreshing every 15 seconds inside each tab, they would be at the limit of what we allow - i.e., 15 charts * (1 chart / 15 seconds) = 1 chart per second. If they then opened up a 16th tab with another auto-refreshing chart in it, they would be in violation of our policy. On the other hand, if they reduced the refresh rate for all of their charts to once every 30 seconds, then they could have up to 30 different charts refreshing at the same time. And so on…